
Economic Scan - British Columbia: 2023
Demographics

Highlights
- In B.C. the number of people aged 65 years and over increased by 3.4%. 19.7% of the population is aged 65 years and over, which is higher then the national rate of 18.9%.
- In 2023, the annual growth rate for youth (aged 15-24 years) was 4.5%. Youth accounted for 11.8% of the total provincial population, lower than the national average.
- The average hourly wage rate in B.C. was $34.68 per hour, higher than the national average rate of $33.55 per hour.
- In 2023, the number of people in the core aged working years (25-54 years) increased by 4.5% annually. The core aged working group represents 42.0% of the population.
In 2023, the population of B.C. reached 4.5 million , an increase of 3.0% compared to 2022, in line with the national growth rate (2.9%).
In 2023, the unemployment rate for Indigenous people in B.C. was 8.1%, which was 1.8 percentage points higher than the 2022 rate. The unemployment rate for Indigenous people is also 2.9 percentage points higher than that of the total population in B.C. Compared to the rest of the W-T, B.C. has the lowest unemployment rate for Indigenous people.
Of all the provinces in the W-T, B.C. has the highest proportion of people that are visible minorities ( 34.4%), followed by Alberta (27.8%). The proportion of visible minorities is also higher in B.C. than the national proportion of 26.5%.
In 2023, there were 950,500 landed immigrants in the labour force in B.C., an increase of 2.5% compared to 2022 and 10.8% since 2019. In recent years, labour market growth in the province has primarily been driven by an increase in the number of landed immigrants arriving in the province.
In 2022, 26.2% of people in B.C. aged 15 and over identified as a person with disabilities (PWD). There has been wide differences in income and employment outcomes for people with disabilities compared to the total population in B.C. For instance, the average median after tax income for the total population in B.C. was $37,780 compared to $35,010 for PWD's.
Source : Statistics Canada - Canadian Survey on Disability (CSD) 2022.
Labour Market Conditions
In 2023...
Employment grew slightly (1.6%)
Unemployment is up sharply (14.5%)
Participation rate increased (65.1% to 65.2%)
Employment rate decreased (62.1% to 61.8%)
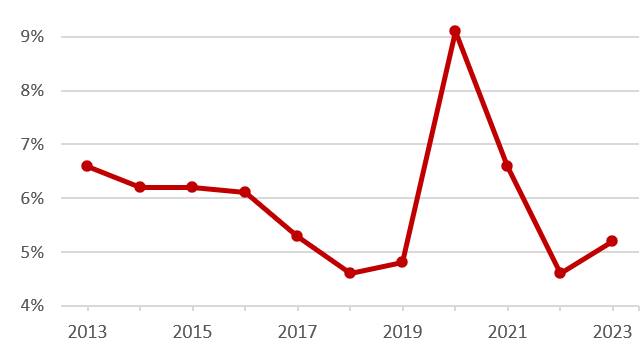
Show data table
| Year | Unemployment Rate (%) |
|---|---|
| 2013 | 6.6 |
| 2014 | 6.2 |
| 2015 | 6.2 |
| 2016 | 6.1 |
| 2017 | 5.3 |
| 2018 | 4.6 |
| 2019 | 4.8 |
| 2020 | 9.1 |
| 2021 | 6.6 |
| 2022 | 4.6 |
| 2023 | 5.2 |
- After decreasing by a full 2.0 percentage points in 2022, the unemployment rate in B.C. increased by 0.6 percentage points in 2023, as increased interest rates and persistently high inflation rates negatively impacted the economy.
- Economic conditions have led to the cooling of what has been a very tight labour market since the global pandemic. Job vacancy rates in Q3 2023 were 4.6%, compared to 6.2% in Q3 2022.
- A high amount of immigration was the primary driver which led to an increase in the size of the labour force of 2.2%.
Economic Conditions
British Columbia's Economic Drivers in 2023
Increased immigration
Strong wage growth
Large-scale projects
Source : The Conference Board of Canada. Provincial Five-Year Outlook. November 2023.
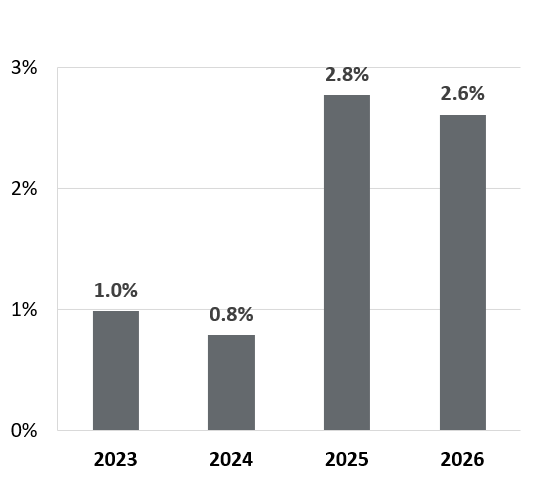
Show data table
| Year | Forecasted GDP Growth Rate |
|---|---|
| 2023 | 1.0% |
| 2024 | 0.8% |
| 2025 | 2.8% |
| 2026 | 2.6% |
- Throughout much of 2023, B.C.'s labour market remained resilient in the face of high inflation and increasing interest rates. However, towards the end of the year, there were signs that national economic conditions are starting to affect the provincial economy.
- B.C. experienced its worst wildfire season on record in 2023. There were direct and indirect impacts to many different sectors, including tourism, forestry, agriculture, and transportation.
- Population growth remained robust in the province throughout 2023, primarily due to international immigration. In fact, B.C. saw the largest quarterly population increase in its history during Q3 of 2023.
- Despite the increase in population, the province experienced a tight labour market for much of the year. However, there are signs that the labour market is loosening slowly heading into 2024.
- Relatively strong wage growth rates in B.C. helped to fuel consumption in the province. Consumption grew by 5.7% in 2023, which was the highest growth rate amongst the provinces.
Reviewing 2023...
Risks to the British Columbia Economy in 2024
- Wage growth in B.C. was higher than the national average in 2023 (6.5% to 5.0%). Higher than average wage growth rates in B.C. could keep inflation higher than the national target rate of 2.0%.
- Record breaking wildfires severely affected many different sectors in the province, including tourism, agriculture and forestry. Drought conditions persist and could lead to another long and intense wildfire season in 2024.
- Immigration to B.C. has been high recently and should continue in the short term. However, lower GDP rates mean that GDP per capita will decrease.
Regional Issues
Migration
For the period from July 1, 2022 to July 1, 2023, B.C. lost a net of 8,439 people through inter-provincial migration. However, during the same time period, B.C. added 66,268 people through international immigration.
Strong population growth should continue in 2024, before levelling off starting in 2025. However, the provinces high cost of living could spur increased inter-provincial migration.
Industry Trends
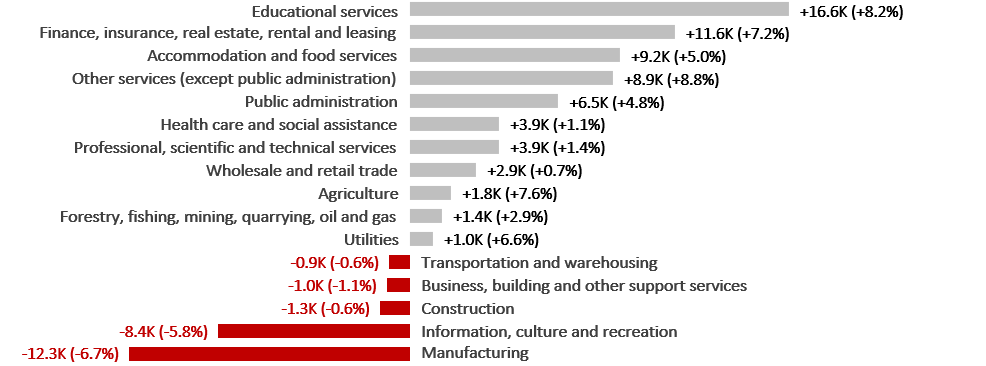
Show data table
| Industry (NAICS) | Employment Change('000s) | Percent Change(%) |
|---|---|---|
| Educational services | +16.6 | +8.2 |
| Finance, insurance, real estate, rental and leasing | +11.6 | +7.2 |
| Accommodation and food services | +9.2 | +5.0 |
| Other services (except public administration) | +8.9 | +8.8 |
| Public administration | +6.5 | +4.8 |
| Health care and social assistance | +3.9 | +1.1 |
| Professional, scientific and technical services | +3.9 | +1.4 |
| Wholesale and retail trade | +2.9 | +0.7 |
| Agriculture | +1.8 | +7.6 |
| Forestry, fishing, mining, quarrying, oil and gas | +1.4 | +2.9 |
| Utilities | +1.0 | +6.6 |
| Transportation and warehousing | -0.9 | -0.6 |
| Business, building and other support services | -1.0 | -1.1 |
| Construction | -1.3 | -0.6 |
| Information, culture and recreation | -8.4 | -5.8 |
| Manufacturing | -12.3 | -6.7 |
- B.C.'s forestry sector has faced closures and curtailments of mills throughout the province as the sector grapples with fibre supply shortages, forest fires and other issues. Thirteen mills faced complete closures or long curtailments over the last year. The forestry and logging and support activities for forestry lost about 4,000 jobs (-22.6%) from 2022 to 2023.
- Employment in the health care and social assistance sector increased by 3,900 jobs (+1.1%). The province experienced temporary emergency department closures due to labour shortages throughout 2023.
- In the construction sector, employment decreased by 1,300 jobs (-0.6%) in 2023. Employment should increase due to demand for housing in the short term.
Regional Economic Conditions
- The North Coast and Nechako (+3.1%) region recorded the highest employment growth by percentage in the province, followed by the Lower Mainland-Southwest (2.3%).
- The Thompson-Okanagan region and the Vancouver Island and Coast region both had the lowest unemployment rates in the province at 4.2%. However, the low unemployment rate in the Thompson-Okanagan region is mainly because the labour force decreased in that region by 1.6%.
Employment Change by Economic Region, 2023
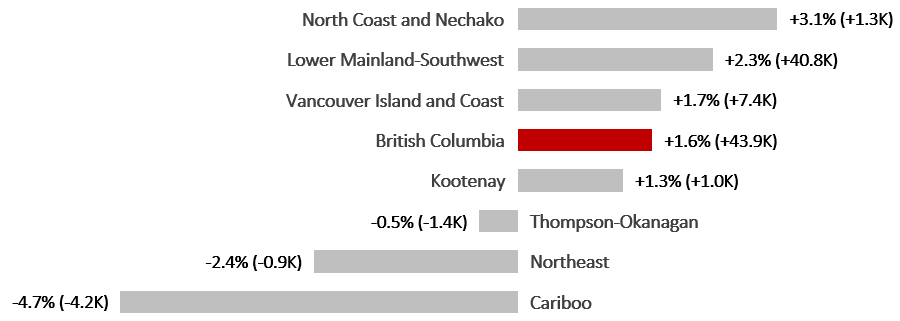
Show data table
| Economic Region | Percent Change(%) | Employment Change('000s) |
|---|---|---|
| North Coast and Nechako | +3.1 | +1.3 |
| Lower Mainland-Southwest | +2.3 | +40.8 |
| Vancouver Island and Coast | +1.7 | +7.4 |
| British Columbia | +1.6 | +43.9 |
| Kootenay | +1.3 | +1.0 |
| Thompson-Okanagan | -0.5 | -1.4 |
| Northeast | -2.4 | -0.9 |
| Cariboo | -4.7 | -4.2 |
- Date modified: