
Labour Market Bulletin - Nova Scotia: October 2022
This Labour Market Bulletin provides an analysis of Labour Force Survey results for the province of Nova Scotia, including the regions of Cape Breton, North Shore, Annapolis Valley, Southern, and Halifax.
Overview
Employment in Nova Scotia edged upward in October as a large increase in the number of full-time workers (+6,500) was mostly offset by a decline in part-time employment. The level of full-time employment in the province surpassed 400,000 for the first time on record. Even so, the unemployment rate increased by 0.5 percentage points (pp) to 6.7% as the number of people who entered the labour force seeking work outpaced the rate of job growth.
| Seasonally adjusted monthly data |
Oct 2022 | Sep 2022 | Oct 2021 | Monthly variation | Yearly variation | ||
|---|---|---|---|---|---|---|---|
| Number | % | Number | % | ||||
| Population 15 + ('000) | 848.1 | 846.2 | 825.3 | 1.9 | 0.2 | 22.8 | 2.8 |
| Labour force ('000) | 515.7 | 512.0 | 510.1 | 3.7 | 0.7 | 5.6 | 1.1 |
| Employment ('000) | 480.9 | 480.2 | 467.2 | 0.7 | 0.1 | 13.7 | 2.9 |
| Full-time ('000) | 402.5 | 396.0 | 375.9 | 6.5 | 1.6 | 26.6 | 7.1 |
| Part-time ('000) | 78.4 | 84.2 | 91.3 | -5.8 | -6.9 | -12.9 | -14.1 |
| Unemployment ('000) | 34.8 | 31.9 | 42.9 | 2.9 | 9.1 | -8.1 | -18.9 |
| Unemployment rate (%) | 6.7 | 6.2 | 8.4 | 0.5 | - | -1.7 | - |
| Participation rate (%) | 60.8 | 60.5 | 61.8 | 0.3 | - | -1.0 | - |
| Employment rate (%) | 56.7 | 56.7 | 56.6 | 0.0 | - | 0.1 | - |
Note: Totals may not add due to rounding
Source: Statistics Canada Labour Force Survey - Table 14-10-0287
Since October 2021, employment has increased by 13,700 (+2.9%), all of which was full-time in nature. Over the same time period, the labour force expanded by just 5,600 (+1.1%) individuals. Together, these changes served to draw down the number of unemployed jobseekers in the province by 8,100 and the lower unemployment rate from 8.4% to 6.7%.
Though the labour force expanded over the past year, the working-age population (15 years and older) grew at an even faster pace (+2.8%). As a result, the participation rate–the share of working-age individuals active in the labour force–fell from 61.8% to 60.8%.
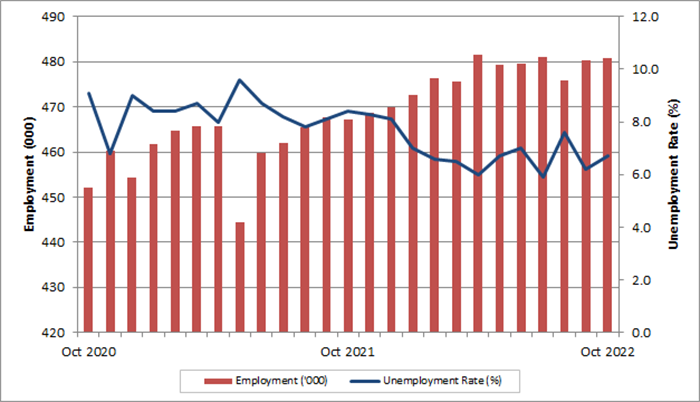
Show data table: Nova Scotia monthly employment and unemployment rate
| Unemployment rate (%) | Employment ('000) | |
|---|---|---|
| Oct 2020 | 9.1 | 452.1 |
| Nov 2020 | 6.8 | 460.2 |
| Dec 2020 | 9.0 | 454.3 |
| Jan 2021 | 8.4 | 461.7 |
| Feb 2021 | 8.4 | 464.6 |
| Mar 2021 | 8.7 | 465.6 |
| Apr 2021 | 8.0 | 465.6 |
| May 2021 | 9.6 | 444.3 |
| Jun 2021 | 8.7 | 459.7 |
| Jul 2021 | 8.2 | 461.9 |
| Aug 2021 | 7.8 | 465.4 |
| Sep 2021 | 8.1 | 467.7 |
| Oct 2021 | 8.4 | 467.2 |
| Nov 2021 | 8.3 | 468.7 |
| Dec 2021 | 8.1 | 469.9 |
| Jan 2022 | 7.0 | 472.6 |
| Feb 2022 | 6.6 | 476.3 |
| Mar 2022 | 6.5 | 475.6 |
| Apr 2022 | 6.0 | 481.5 |
| May 2022 | 6.7 | 479.4 |
| Jun 2022 | 7.0 | 479.5 |
| Jul 2022 | 5.9 | 481.1 |
| Aug 2022 | 7.6 | 475.9 |
| Sep 2022 | 6.2 | 480.2 |
| Oct 2022 | 6.7 | 480.9 |
Source: Statistics Canada Labour Force Survey
The number of public and private-sector employees increased at comparable rates over the past year, at 4.1% (+4,900) and 3.5% (+10,000) respectively, while the number of self-employed individuals declined by 1.9% (-1,100). Despite this growth, the private sector employs 5,000 fewer workers than before the pandemic (February 2020), while public-sector employment has expanded by 17,300 over the same period of time.
| Seasonally adjusted data | Oct 2022 (%) | Sep 2022 (%) | Oct 2021 (%) | Monthly variation (% points) |
Yearly variation (% points) |
|---|---|---|---|---|---|
| Total | 6.7 | 6.2 | 8.4 | 0.5 | -1.7 |
| 25 years and over | 5.6 | 5.2 | 8.1 | 0.4 | -2.5 |
| Men - 25 years and over | 6.7 | 6.0 | 9.2 | 0.7 | -2.5 |
| Women - 25 years and over | 4.5 | 4.4 | 6.9 | 0.1 | -2.4 |
| 15 to 24 years | 13.6 | 12.3 | 10.2 | 1.3 | 3.4 |
| Men - 15 to 24 years | 16.0 | 14.4 | 9.6 | 1.6 | 6.4 |
| Women - 15 to 24 years | 11.3 | 10.1 | 11.1 | 1.2 | 0.2 |
Source: Statistics Canada Labour Force Survey - Table 14-10-0287
Year-over-year changes in labour market outcomes differed substantially by age group. While all age brackets benefited from the growth of full-time employment, declining part-time employment offset these gains to varying degrees. Prime working-age individuals (25 to 54 years of age) experienced the greatest overall improvement by a wide margin, with a total employment increase of 15,400 (+5.4%). The unemployment rate for this age group declined from 8.0% to 5.1%.
Changes were less positive for youth (15 to 24 years of age) and older workers (55 years and older). Among youth, there was an overall employment decline of 2,400 (-3.6%) as part-time job losses outnumbered full-time gains nearly two-to-one. The youth unemployment rate rose from 10.2% to 13.6%. Changes in full- and part-time work among older workers almost balanced out (+5,000 and -4,300 respectively), yielding a small net employment increase of 700 (+0.6%).
On an annual basis, job growth was divided relatively evenly by sex, with employment climbing by 6,300 among males and by 7,400 among females. As is typical from a historical perspective, the female unemployment rate was lower than for males in October (5.5% compared to 7.9%). Females accounted for more than half of employment in the youth and prime working-age groups, while the reverse was true in the older worker bracket.
Employment by industry
The goods-producing sector accounted for the majority of employment growth over the past 12 months, adding 10,100 workers (+11.5%). Employment in the larger services-producing sector went up by 3,600 (+0.9%).
Job growth in the goods-producing sector was driven largely by the construction industry, which added 8,800 (+26.4%) employees year-over-year. In addition to a variety of provincial capital projects, demand for residential construction has been boosted by historically high levels of population growth. Over 9,000 dwellings were under construction in Q3 2022, the highest level since comparable records began in 1948. The number of workers in the manufacturing industry also went up, by 3,000, while employment in the utilities industry declined (-1,000).
Within the services-producing sector, the largest year-over-year employment increase was observed in the health care and social assistance industry (+4,800). Employment in this industry has trended upward throughout 2022 amid growing demand for health care from the aging population, and ongoing recruitment efforts by the provincial government. The information, culture and recreation industry added 4,300 workers on an annual basis, and has returned to pre-pandemic employment levels during the past three months. Job growth also occurred finance, insurance, real estate, rental and leasing (+3,000).
The largest employment decline over the past year occurred in transportation and warehousing (-5,600), though it should be noted that employment was unusually high in the baseline month of October 2021. Declines since then have returned the level of employment in this industry to longer-term historical averages. The wholesale and retail trade industry employed 5,000 fewer workers than one year earlier; this industry has remained persistently below pre-pandemic levels and reports of labour shortages have become common. The business, building and other support services industry also shed workers year-over-year (-3,400).
Annual job gains were insignificant in all other industries. This includes professional, scientific and technical services, in which employment growth has cooled following a rapid expansion of nearly 50% between mid-2020 and mid-2022. Job growth was also negligible in the accommodation and food services industry, which remains 20% below pre-pandemic employment levels amid widespread reports of labour shortages and rising input costs.
| Seasonally adjusted data ('000) | Oct 2022 | Sep 2022 | Oct 2021 | Monthly variation | Yearly variation | ||
|---|---|---|---|---|---|---|---|
| Number | % | Number | % | ||||
| Total employed, all industries | 480.9 | 480.2 | 467.2 | 0.7 | 0.1 | 13.7 | 2.9 |
| Goods-producing sector | 98.0 | 92.9 | 87.9 | 5.1 | 5.5 | 10.1 | 11.5 |
| Agriculture | 5.0 | 4.5 | 6.3 | 0.5 | 11.1 | -1.3 | -20.6 |
| Forestry, fishing, mining, quarrying, oil and gas | 10.9 | 11.0 | 10.3 | -0.1 | -0.9 | 0.6 | 5.8 |
| Utilities | 4.3 | 4.3 | 5.3 | 0.0 | 0.0 | -1.0 | -18.9 |
| Construction | 42.1 | 41.0 | 33.3 | 1.1 | 2.7 | 8.8 | 26.4 |
| Manufacturing | 35.7 | 32.0 | 32.7 | 3.7 | 11.6 | 3.0 | 9.2 |
| Services-producing sector | 382.9 | 387.3 | 379.3 | -4.4 | -1.1 | 3.6 | 0.9 |
| Trade | 70.7 | 74.0 | 75.7 | -3.3 | -4.5 | -5.0 | -6.6 |
| Transportation and warehousing | 20.9 | 19.4 | 26.5 | 1.5 | 7.7 | -5.6 | -21.1 |
| Finance, insurance, real estate and leasing | 25.3 | 24.0 | 22.3 | 1.3 | 5.4 | 3.0 | 13.5 |
| Professional, scientific and technical services | 36.7 | 37.5 | 35.2 | -0.8 | -2.1 | 1.5 | 4.3 |
| Business, building and other support services | 15.7 | 16.7 | 19.1 | -1.0 | -6.0 | -3.4 | -17.8 |
| Educational services | 38.9 | 38.9 | 36.5 | 0.0 | 0.0 | 2.4 | 6.6 |
| Health care and social assistance | 79.9 | 80.9 | 75.1 | -1.0 | -1.2 | 4.8 | 6.4 |
| Information, culture and recreation | 17.6 | 18.4 | 13.3 | -0.8 | -4.3 | 4.3 | 32.3 |
| Accommodation and food services | 29.7 | 29.4 | 29.3 | 0.3 | 1.0 | 0.4 | 1.4 |
| Other services | 16.3 | 16.7 | 16.1 | -0.4 | -2.4 | 0.2 | 1.2 |
| Public administration | 31.3 | 31.5 | 30.2 | -0.2 | -0.6 | 1.1 | 3.6 |
Note: Totals may not add due to rounding
Source: Statistics Canada Labour Force Survey - Table 14-10-0355
Regional analysis
Year-over-year employment growth was concentrated in the Halifax and Annapolis Valley economic regions, while declines were observed in Cape Breton and the North Shore. The number of workers in the Southern region saw little change. There was clear shift toward more full-time employment–and less part-time–in most regions, while positive growth of the working-age population was noted in all parts of the province.
Employment declined by 2,100 on a year-over-year basis in Cape Breton as a decrease in the number of part-time positions outpaced gains in full-time work. Despite this job loss, the unemployment rate declined from 11.9% to 10.2% as the labour force contracted by 2,300 individuals. While the manufacturing and educational services industries added jobs over the year, large employment declines occurred in the wholesale and retail trade and utilites industries.
The North Shore was the only region in which the number of both full- and part-time jobs declined, with a total year-over-year employment loss of 2,600 workers. The unemployment rate increase from 8.3% to 9.7%. Further, the labour force contracted by 1,800 individuals, leading to a 2.3pp decrease of the participation rate. The construction and health care and social assistance industries posted large job gains, while the agriculture and business, building and other support services industries shed the largest number of workers.
The Annapolis Valley experienced the largest relative annual increase in employment in the province, at 8.7% (+5,000), all of which was full-time. The labour force also expanded, but at a slower rate (+2,800), and the unemployment rate went down from 7.9% to 4.1%. The construction and transportation and warehousing industries added the largest number of workers (2,300 and 1,500 respectively). Conversely, there were 1,100 fewer workers in the accommodation and food services industry than one year prior, and 900 fewer in the agriculture industry.
Employment in the Southern economic region was little-changed as a modest increase in the number of full-time workers edged out a small loss of part-time employment. This job growth, combined with a slight contraction of the labour force, pushed the unemployment rate down by 1.0pp to 7.7%. The business, building and other support services and information, culture and recreation industries added 700 workers each, while the largest employment declines occurred in the educational services industry (-700) and the professional, scientific and technical services industry (-500).
Employment in the Halifax region went up by 9,400 year-over-year, all full-time, while the unemployment rate declined from 6.3% to 5.2%. The labour force expanded by 7,000 individuals, while the working-age population increased even more quickly (+14,800). As a result, the participation slipped from 67.8% to 67.0%, but remained the highest in the province by several percentage points. Job growth in Halifax was led by the accommodation and food services industry (+3,100), while several other industries including health care and social assistance and construction added 2,500 or more workers. Major declines were posted in the transportation and warehousing (-6,500) and wholesale and retail trade (-1,800) industries.
| 3-Month Moving Averages Seasonally Unadjusted Data | Employment | Unemployment rate | ||||
|---|---|---|---|---|---|---|
| Oct 2022 ('000) |
Oct 2021 ('000) |
Yearly variation (%) |
Oct 2022 (%) |
Oct 2021 (%) |
Yearly variation (% points) |
|
| Nova Scotia | 482.6 | 471.5 | 2.4 | 6.5 | 7.7 | -1.2 |
| Economic regions | ||||||
| Cape Breton | 51.7 | 52.8 | -2.1 | 10.2 | 11.9 | -1.7 |
| North Shore | 65.5 | 68.1 | -3.8 | 9.7 | 8.3 | 1.4 |
| Annapolis Valley | 62.5 | 57.5 | 8.7 | 4.1 | 7.9 | -3.8 |
| Southern | 50.5 | 50.2 | 0.6 | 7.7 | 8.7 | -1.0 |
| Halifax | 252.4 | 243.0 | 3.9 | 5.2 | 6.3 | -1.1 |
Note: Totals may not add due to rounding
Source: Statistics Canada Labour Force Survey - Table 14-10-0387
Note
In preparing this document, the authors have taken care to provide clients with labour market information that is timely and accurate at the time of publication. Since labour market conditions are dynamic, some of the information presented here may have changed since this document was published. Users are encouraged to also refer to other sources for additional information on the local economy and labour market. Information contained in this document does not necessarily reflect official policies of Employment and Social Development Canada.
Prepared by: Labour Market Analysis Directorate, Service Canada, Atlantic Region
For further information, please contact the LMI team.
For information on the Labour Force Survey, please visit the Statistics Canada website.
- Date modified: